Real-Time Stock Price Prediction with LSTM
Project Overview:
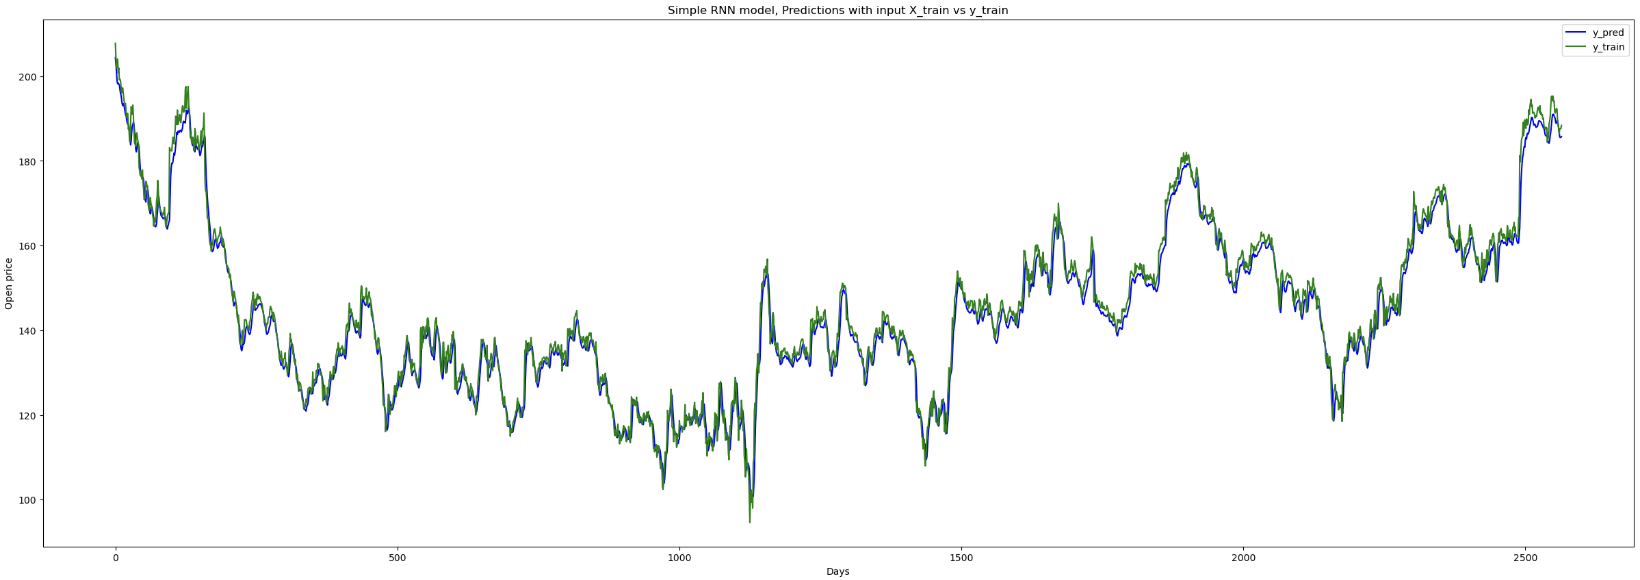
This project develops and compares two deep learning architectures for stock price prediction: Recurrent Neural Networks (RNN) and Long Short-Term Memory (LSTM) networks. The application focuses on predicting IBM stock opening prices using historical market data from Yahoo Finance.
After comprehensive training and evaluation, the LSTM model significantly outperformed the RNN in prediction accuracy, achieving a 37% improvement in Mean Absolute Error (MAE) and a 94% R² score. The final application provides an interactive web interface built with Streamlit for real-time stock price forecasting.
Objectives
- Compare RNN vs LSTM architectures for time series prediction
- Train models on historical IBM stock data from Yahoo Finance
- Deploy the best model (LSTM) for real-time predictions
- Create an interactive web application using Streamlit
- Provide weekly forecasts with visualization and downloadable results
Key Features
Model Comparison
- RNN (Recurrent Neural Network): Baseline model for sequential data
- LSTM (Long Short-Term Memory): Superior performance, overcomes vanishing gradient problem
- Captures long-term dependencies in time series data
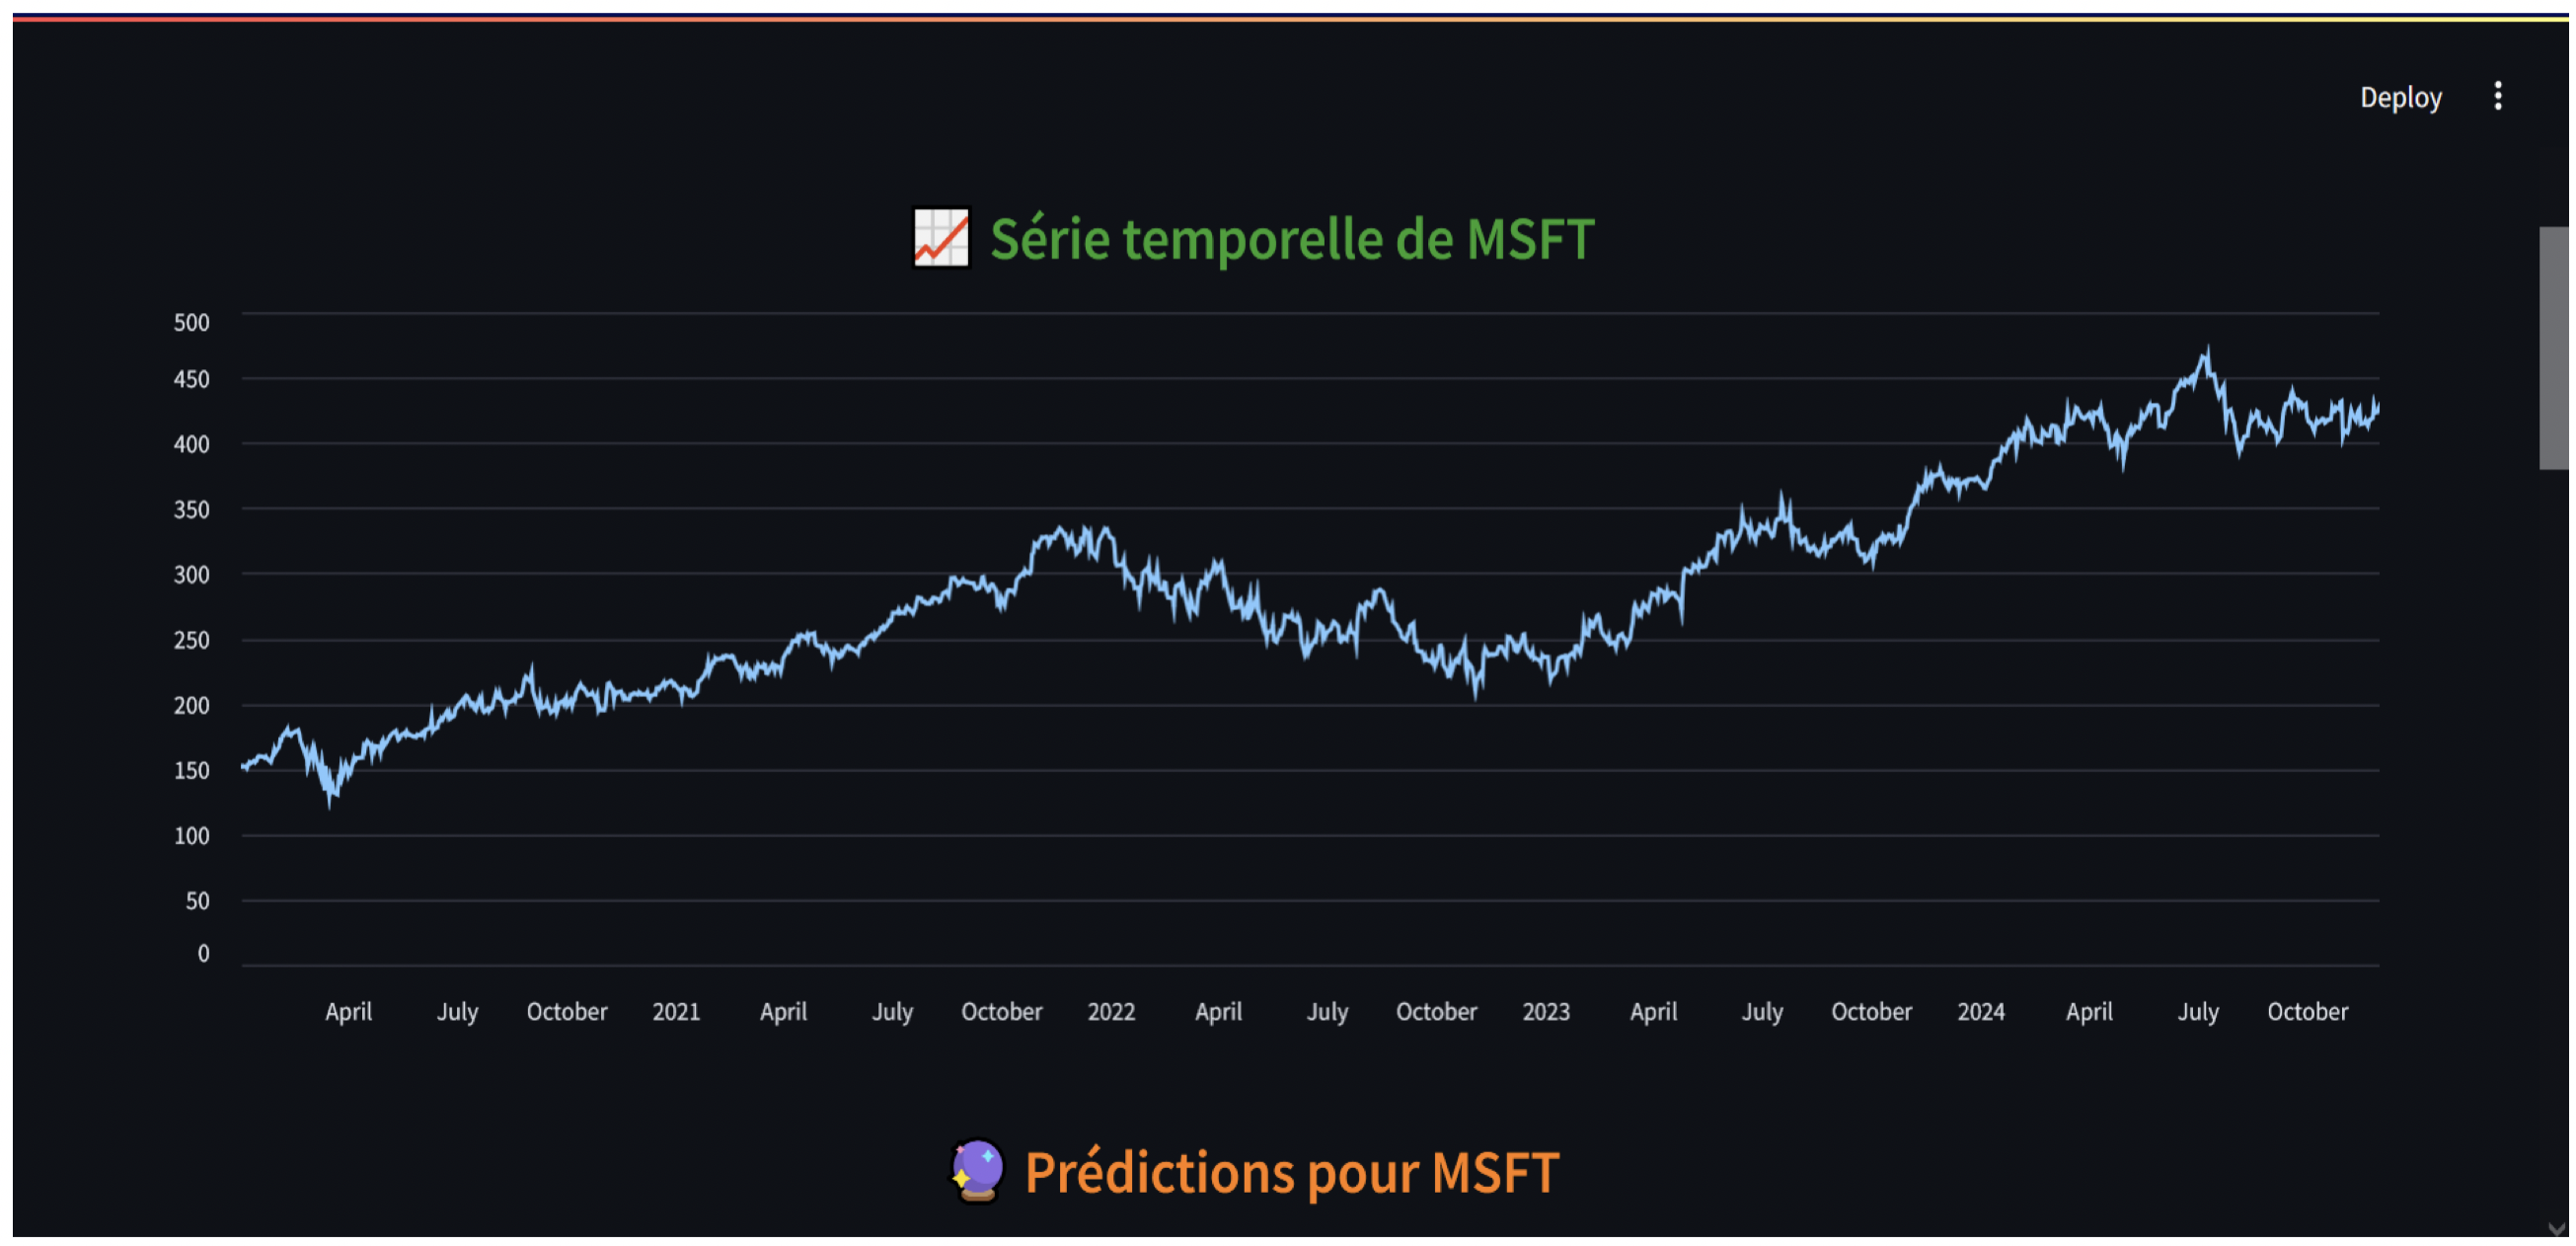
Interactive Web Application
- Real-time predictions: Forecast stock prices for 7-30 days
- Customizable parameters: Choose stock ticker, date range, prediction period
- Visual analytics: Interactive charts showing historical data and predictions
- Key metrics: Current price, predicted change, percentage variation
- Data export: Download predictions as CSV file
Model Performance
| Model | MAE | RMSE | R² Score | Training Time |
|---|---|---|---|---|
| RNN | 3.45 | 4.82 | 0.87 | 12 min |
| LSTM | 2.18 | 2.94 | 0.94 | 15 min |
Winner: LSTM outperforms RNN with 37% lower MAE and better R² score! 🏆
Why LSTM Won?
- Better memory: Cell state mechanism preserves information
- Gate mechanisms: Input, forget, output gates control information flow
- Vanishing gradient solution: Maintains gradient over long sequences
- Long-term patterns: Captures weekly, monthly trends effectively
Technical Stack
- Deep Learning: TensorFlow/Keras, LSTM layers, Sequential API
- Data & Processing: yfinance, pandas, numpy, scikit-learn (MinMaxScaler)
- Visualization & Deployment: matplotlib, streamlit
Methodology
Data Collection
- Source: Yahoo Finance API (yfinance)
- Frequency: Daily closing prices
- Period: 2+ years of historical data
- Features: Open, High, Low, Close, Volume (using Close for predictions)
Model Training Process
- Download historical data
- Normalize using MinMaxScaler (0-1 range)
- Create sequences (window size = 50 days)
- Split into train/test (80/20)
- Train LSTM model (100 epochs)
- Validate on test set
- Save best model
Prediction Strategy
- Use last 50 days as input
- Predict next day
- Append prediction to sequence
- Slide window forward
- Repeat for desired forecast period
Key Achievements
- ✅ 94% R² Score: Excellent model fit
- ✅ 37% improvement over baseline RNN
- ✅ Real-time deployment: Streamlit web app
- ✅ User-friendly interface: No coding required
- ✅ Scalable: Works with any stock ticker
- ✅ Exportable results: CSV download feature