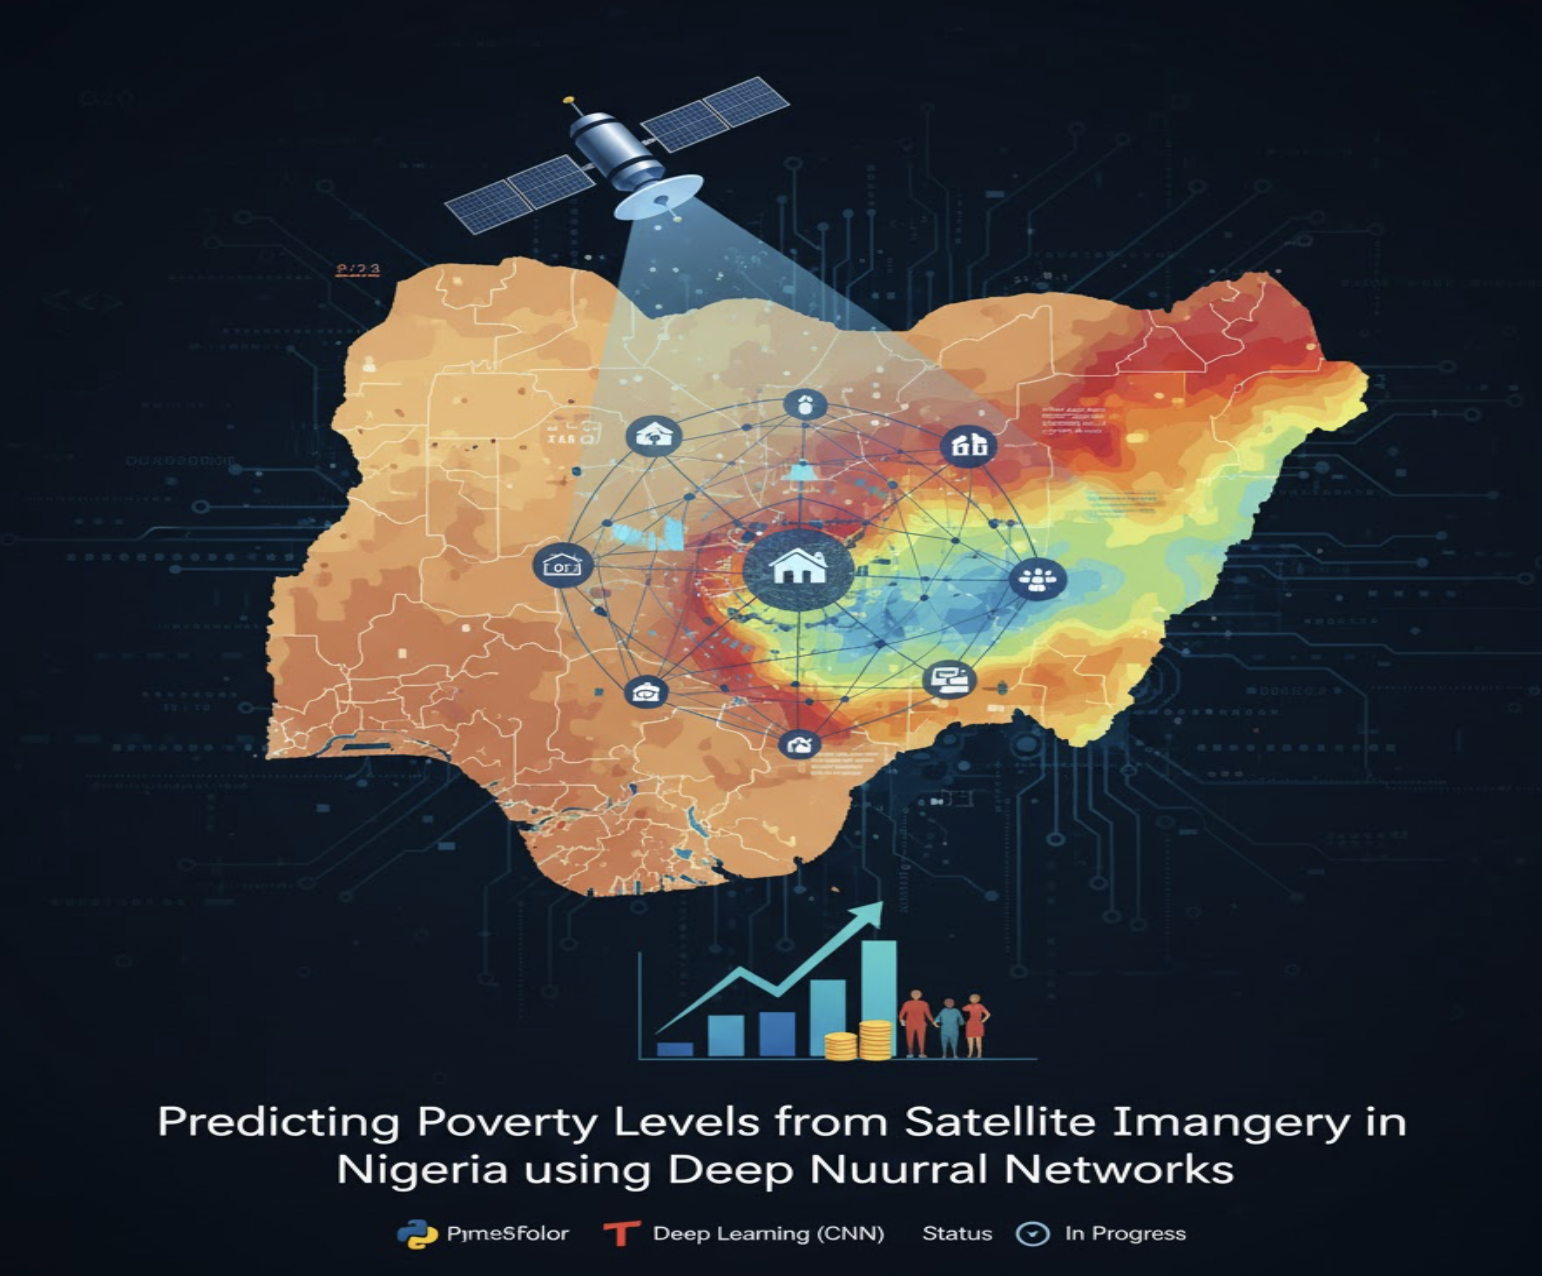
Predicting Poverty Levels from Satellite Imagery in Nigeria using Deep Neural Networks
Project Overview:
Poverty remains a major challenge in many developing countries, and access to detailed, up-to-date information is crucial for guiding public policies and humanitarian interventions. Nigeria, as Africa’s largest economy, faces significant disparities in living standards, particularly in rural areas.
This project leverages Deep Learning and satellite imagery to develop an automated system for predicting and mapping poverty levels across different regions of Nigeria, providing a cost-effective alternative to traditional household surveys.
Objectives
- Predict poverty levels from satellite imagery using Deep Neural Networks (DNN) and Convolutional Neural Networks (CNN)
- Identify the most affected areas by poverty across Nigeria
- Provide detailed insights for strategic decision-making
- Reduce costs associated with traditional surveys while increasing analysis accuracy
- Create a scalable tool that can be applied to other countries or regions
Why This Matters
Problem Statement: Traditional poverty assessment methods rely on expensive household surveys conducted every few years, limited geographic coverage, time-consuming data collection, and outdated information by the time analysis is complete.
Our Solution: By combining satellite imagery with machine learning, we achieve near real-time monitoring of poverty indicators, complete geographic coverage including remote areas, cost-effective analysis, scalability to other regions, and objective and consistent measurements.
Dataset
Satellite Imagery:
- Source: Kaggle - Satellite Images to Predict Poverty in Africa
- Dataset: Nigeria Archive (
nigeria_archive) - Coverage: Multiple regions across Nigeria
- Format: Georeferenced satellite images with GPS coordinates
- Features captured: Infrastructure, natural environment, urban development, vegetation, roads, buildings, nighttime lights
Poverty Data: Images are georeferenced and linked to poverty statistics from the National Bureau of Statistics of Nigeria, creating an annotated dataset that combines visual representation of the environment with corresponding poverty level labels.
Architecture
The model pipeline follows this structure:
Input: Satellite Image (RGB)
    ↓
Convolutional Layers (Feature Extraction)
    ↓
Pooling Layers (Dimensionality Reduction)
    ↓
Fully Connected Layers (Classification)
    ↓
Output: Poverty Level Prediction
Technical Stack
- Deep Learning Framework: TensorFlow / Keras
- CNN Architecture: Custom CNN architecture with transfer learning using pre-trained models (VGG16, ResNet50, InceptionV3)
- Libraries: NumPy, Pandas, Matplotlib/Seaborn, scikit-learn, OpenCV, rasterio/gdal, GeoPandas
Methodology
- Data Collection & Annotation: Collect satellite imagery with GPS coordinates, cross-reference with poverty data, assign labels, create train/validation/test splits
- Image Preprocessing: Normalization, resizing, data augmentation (rotation, flipping, brightness adjustment)
- Model Development: Design CNN architecture, implement transfer learning, fine-tune hyperparameters, apply regularization
- Training: Use Categorical Crossentropy loss, Adam optimizer, learning rate scheduling, early stopping
- Evaluation: Accuracy, Precision, Recall, F1-Score, Confusion Matrix, ROC-AUC curves
- Deployment & Mapping: Generate poverty maps, identify high-poverty regions, create interactive visualizations
Key Features
- Automated Poverty Assessment: No need for expensive field surveys, real-time monitoring capability
- Geographic Coverage: Complete coverage of Nigeria including remote areas
- Cost-Effectiveness: Significantly cheaper than traditional surveys, can be updated frequently
- Policy Impact: Targeted resource allocation, evidence-based decision making, monitoring of poverty reduction programs
Deliverables
- ✅ Trained CNN model for poverty prediction
- ✅ Comprehensive poverty maps of Nigeria
- ✅ Analysis report with regional insights
- ✅ Reusable pipeline for future updates